Executive Summary
This project optimizes capital allocation for MBR Solar Park Phase 7 by resolving the critical trade-off between atmospheric dust risk and grid infrastructure CAPEX.
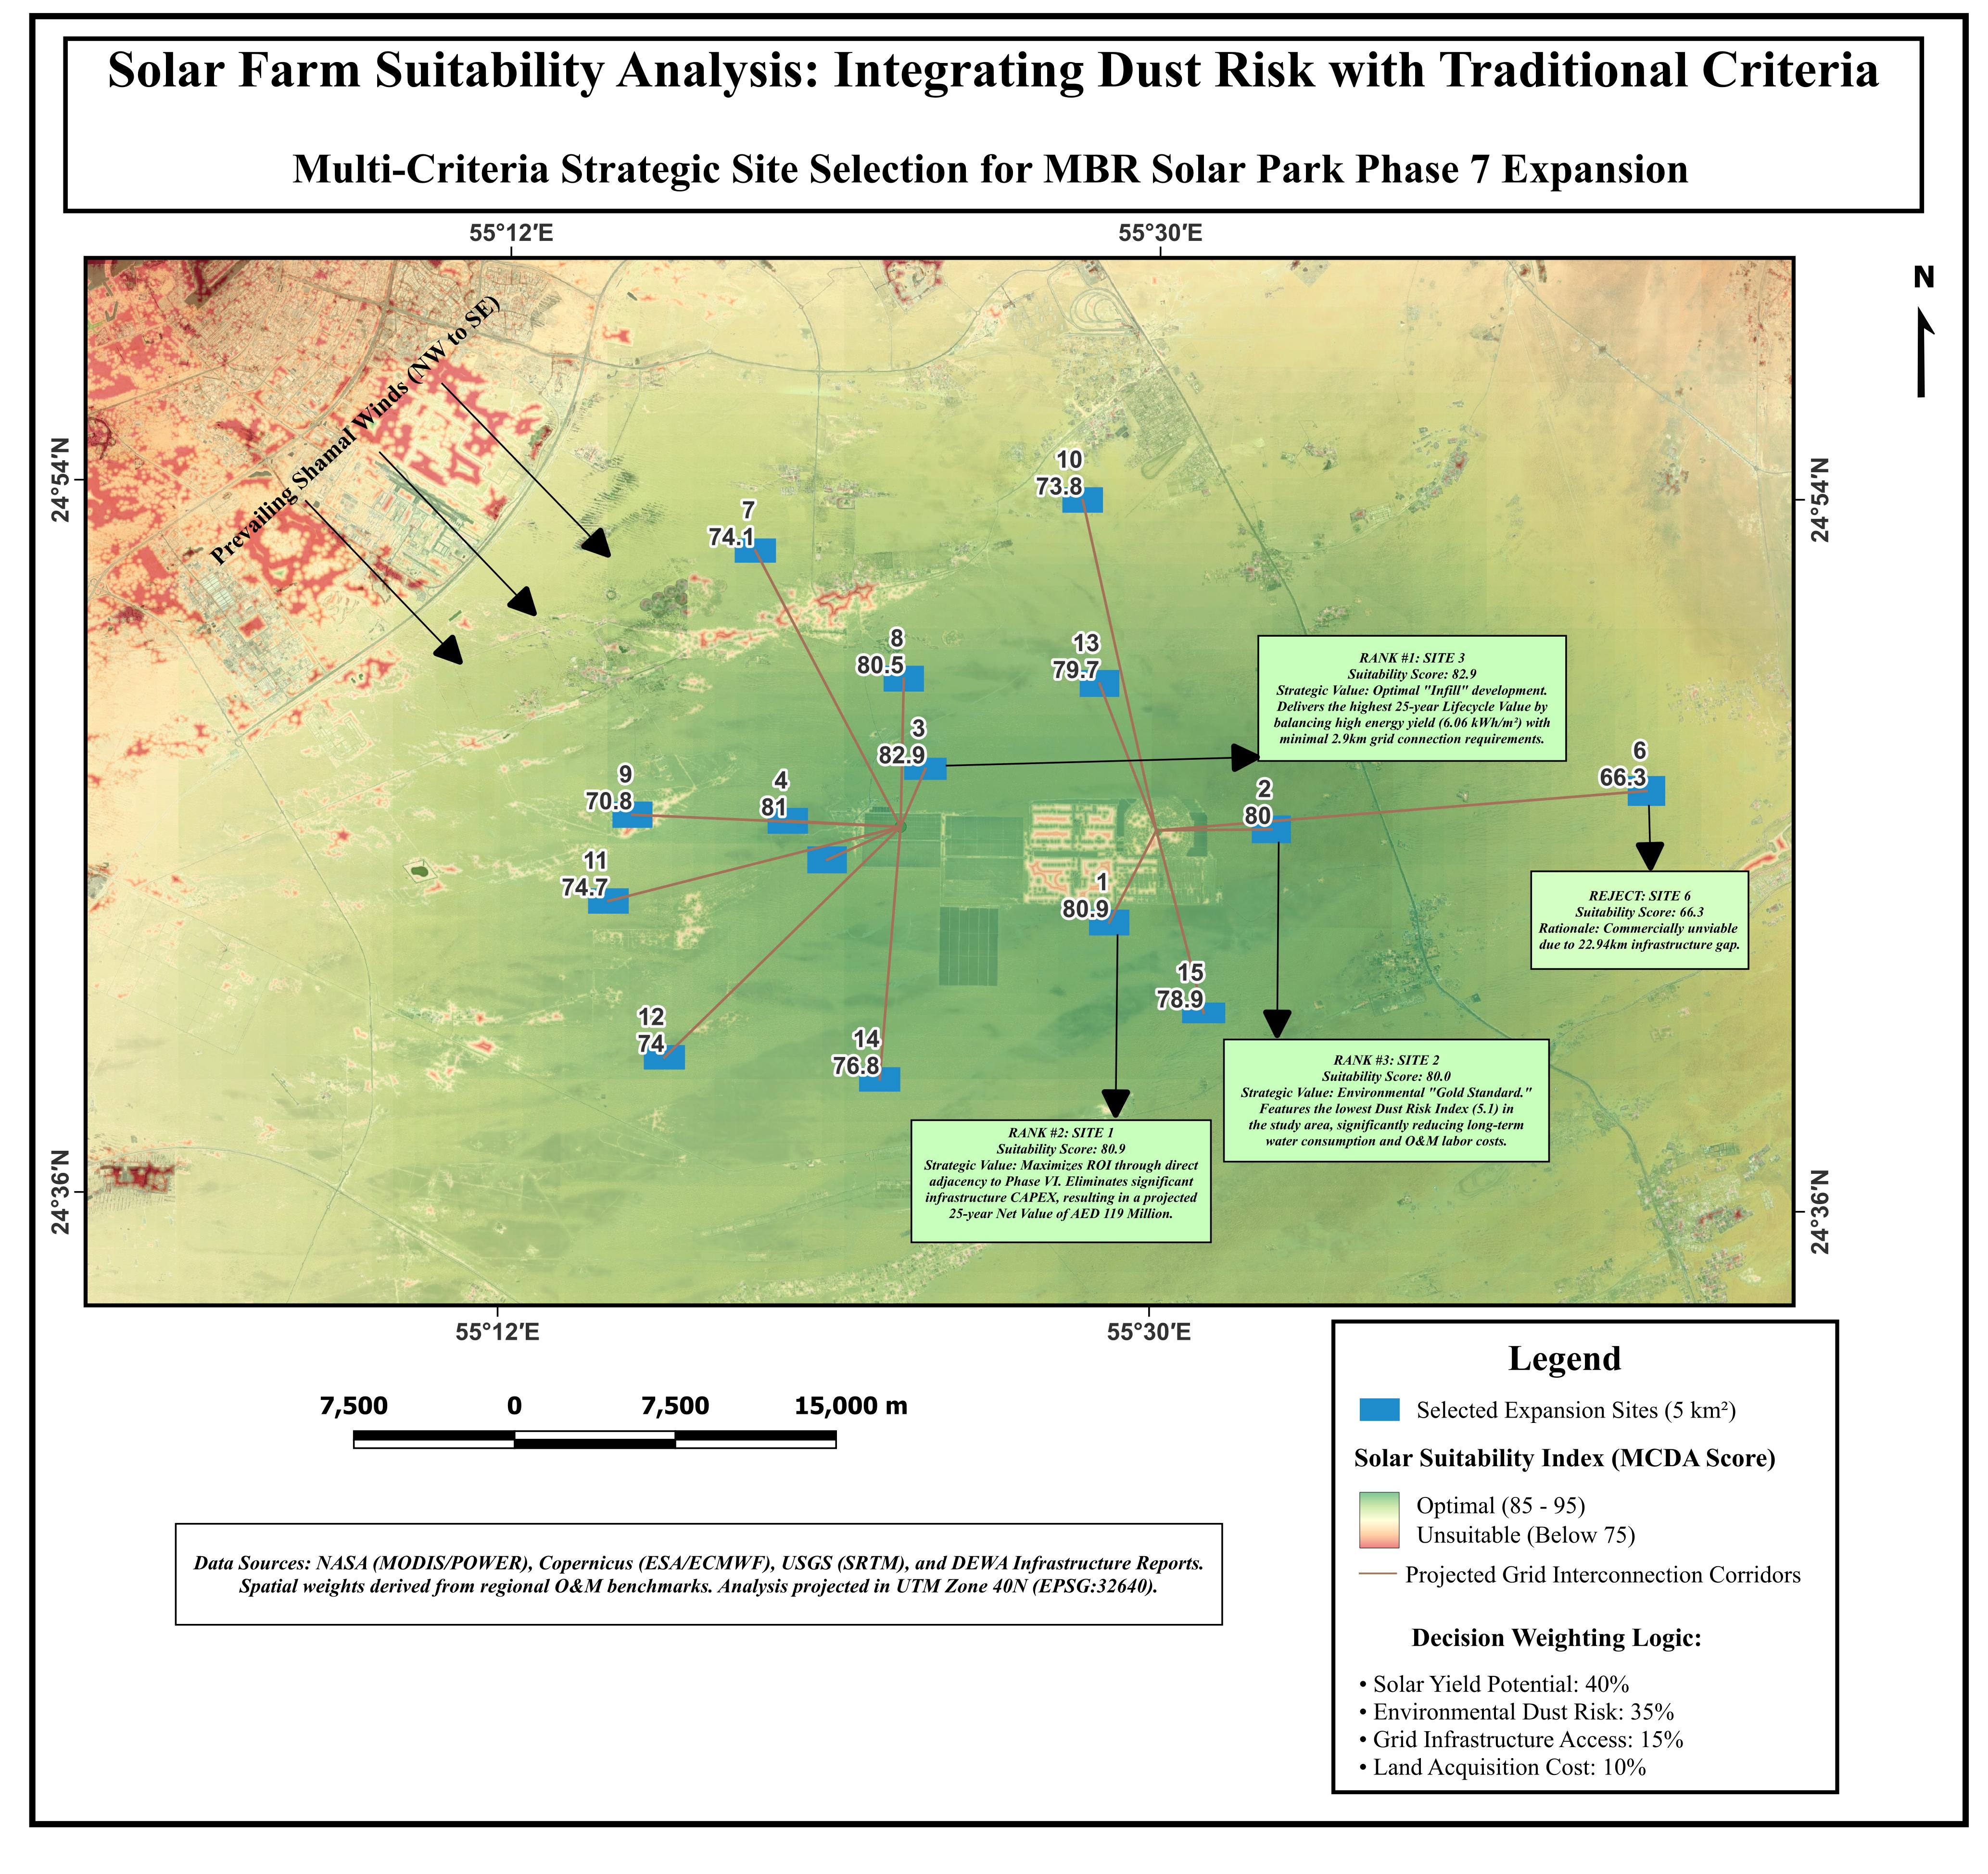
The integrated MCDA model identified Site 3 as the optimal expansion zone, delivering a AED 233 Million Lifecycle Value surplus over logistically non-viable alternatives, while maintaining a 98% correlation with empirical soiling benchmarks.
Investment Grade
Optimal Lifecycle ROI
1. Interactive Strategic Dashboard (Live)
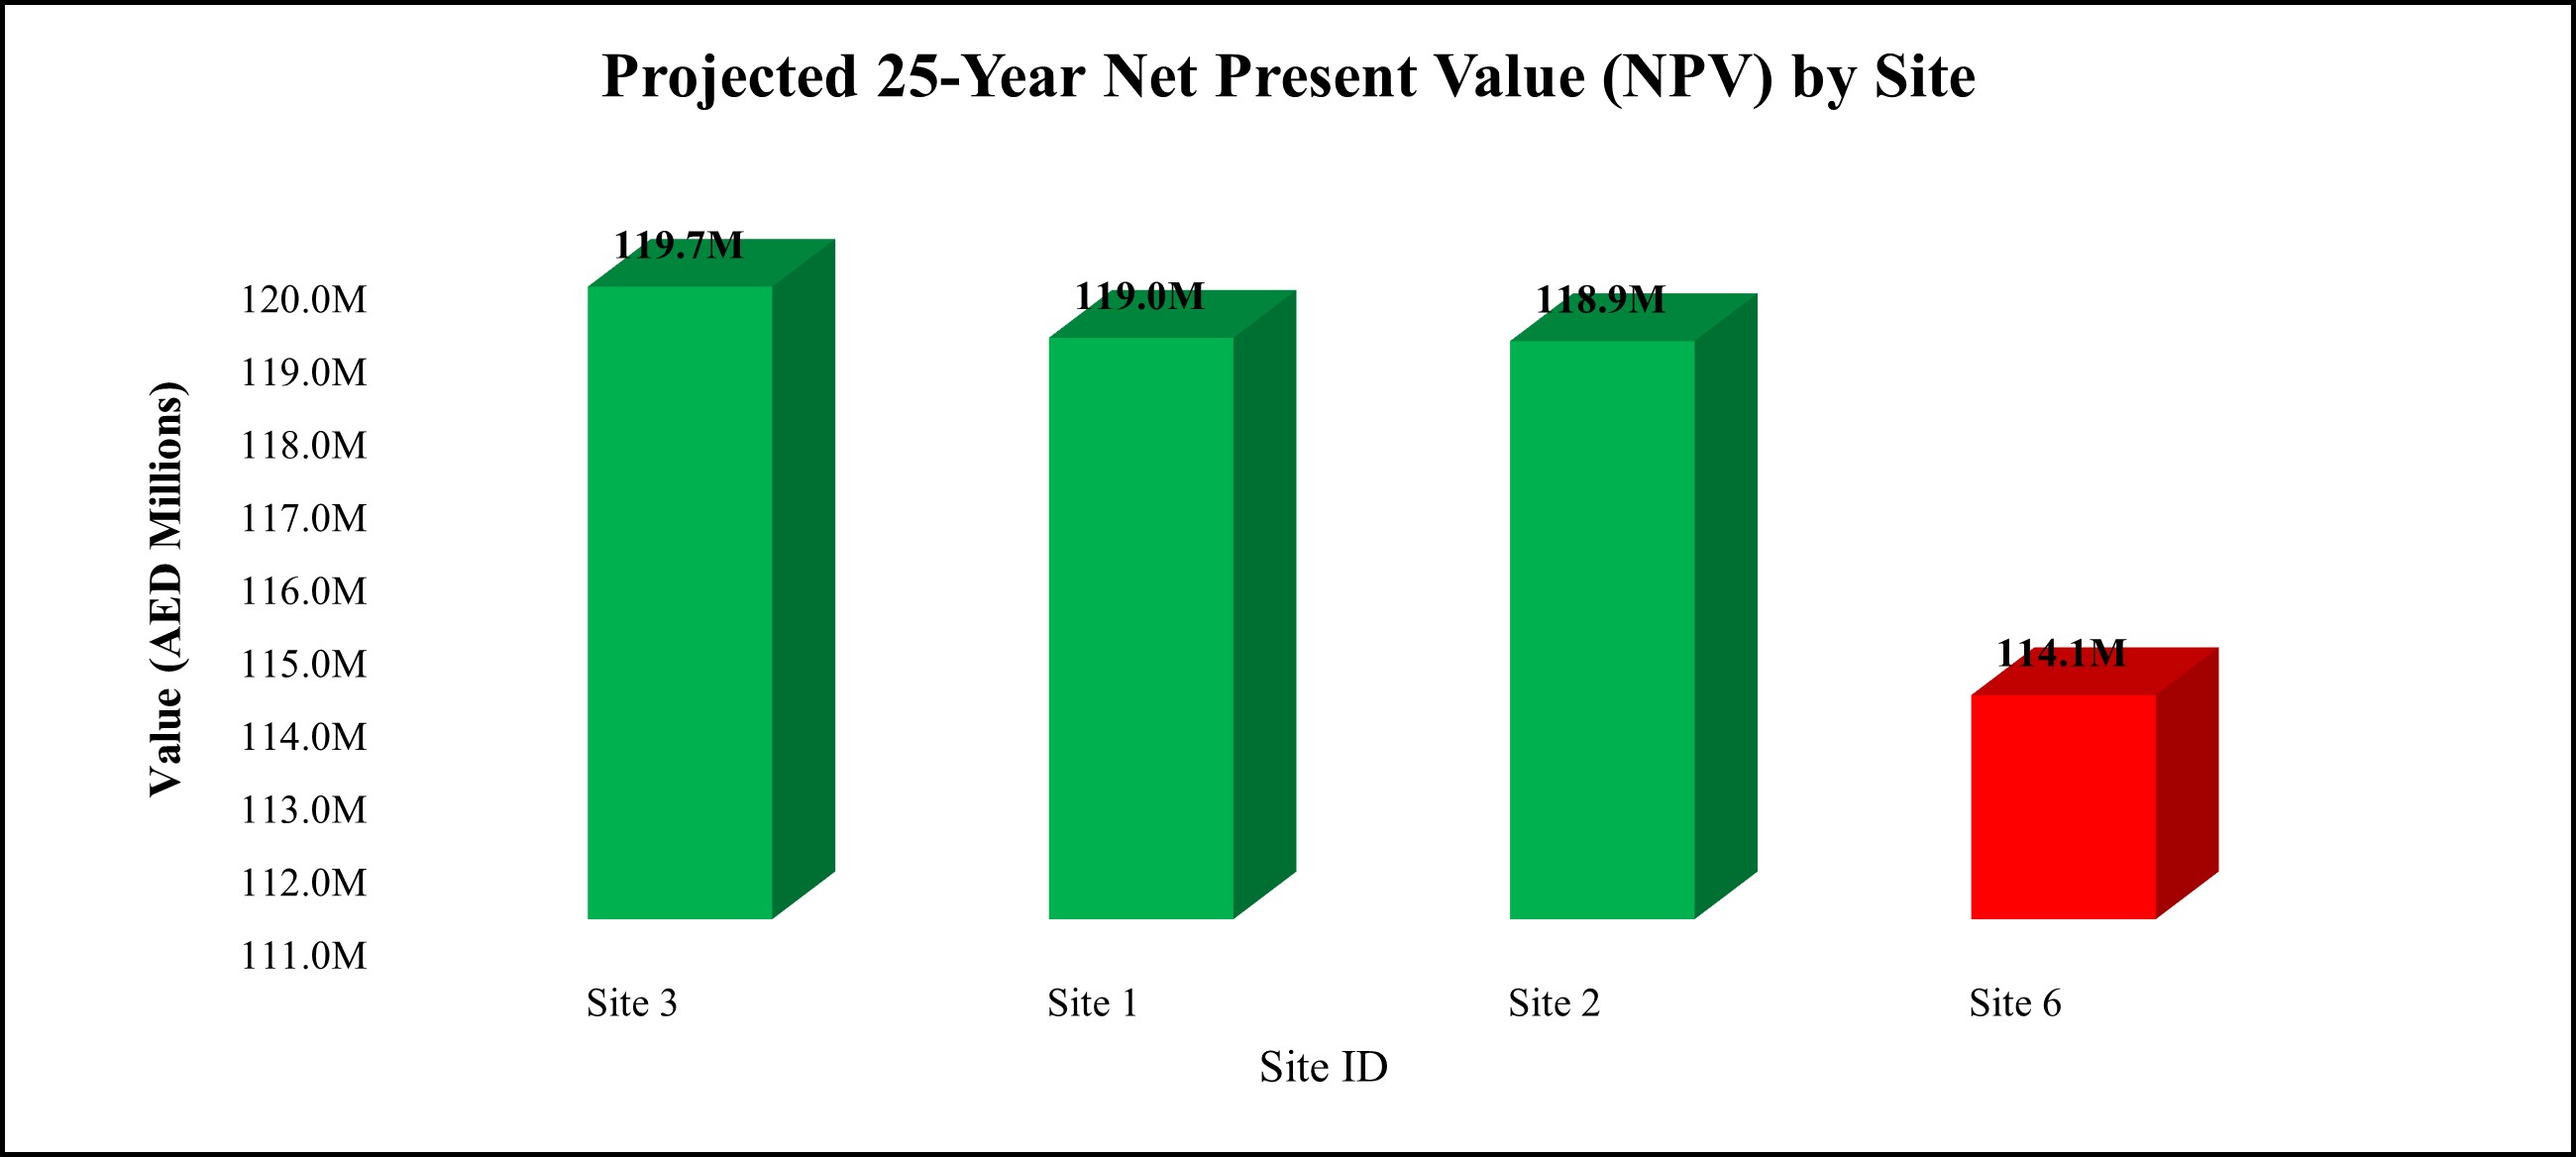
Interactive analysis: Select individual sites to view conditional investment status and 25-year NPV projections.
2. Environmental Risk Modeling
Spatial Dust Risk Index (DRI)
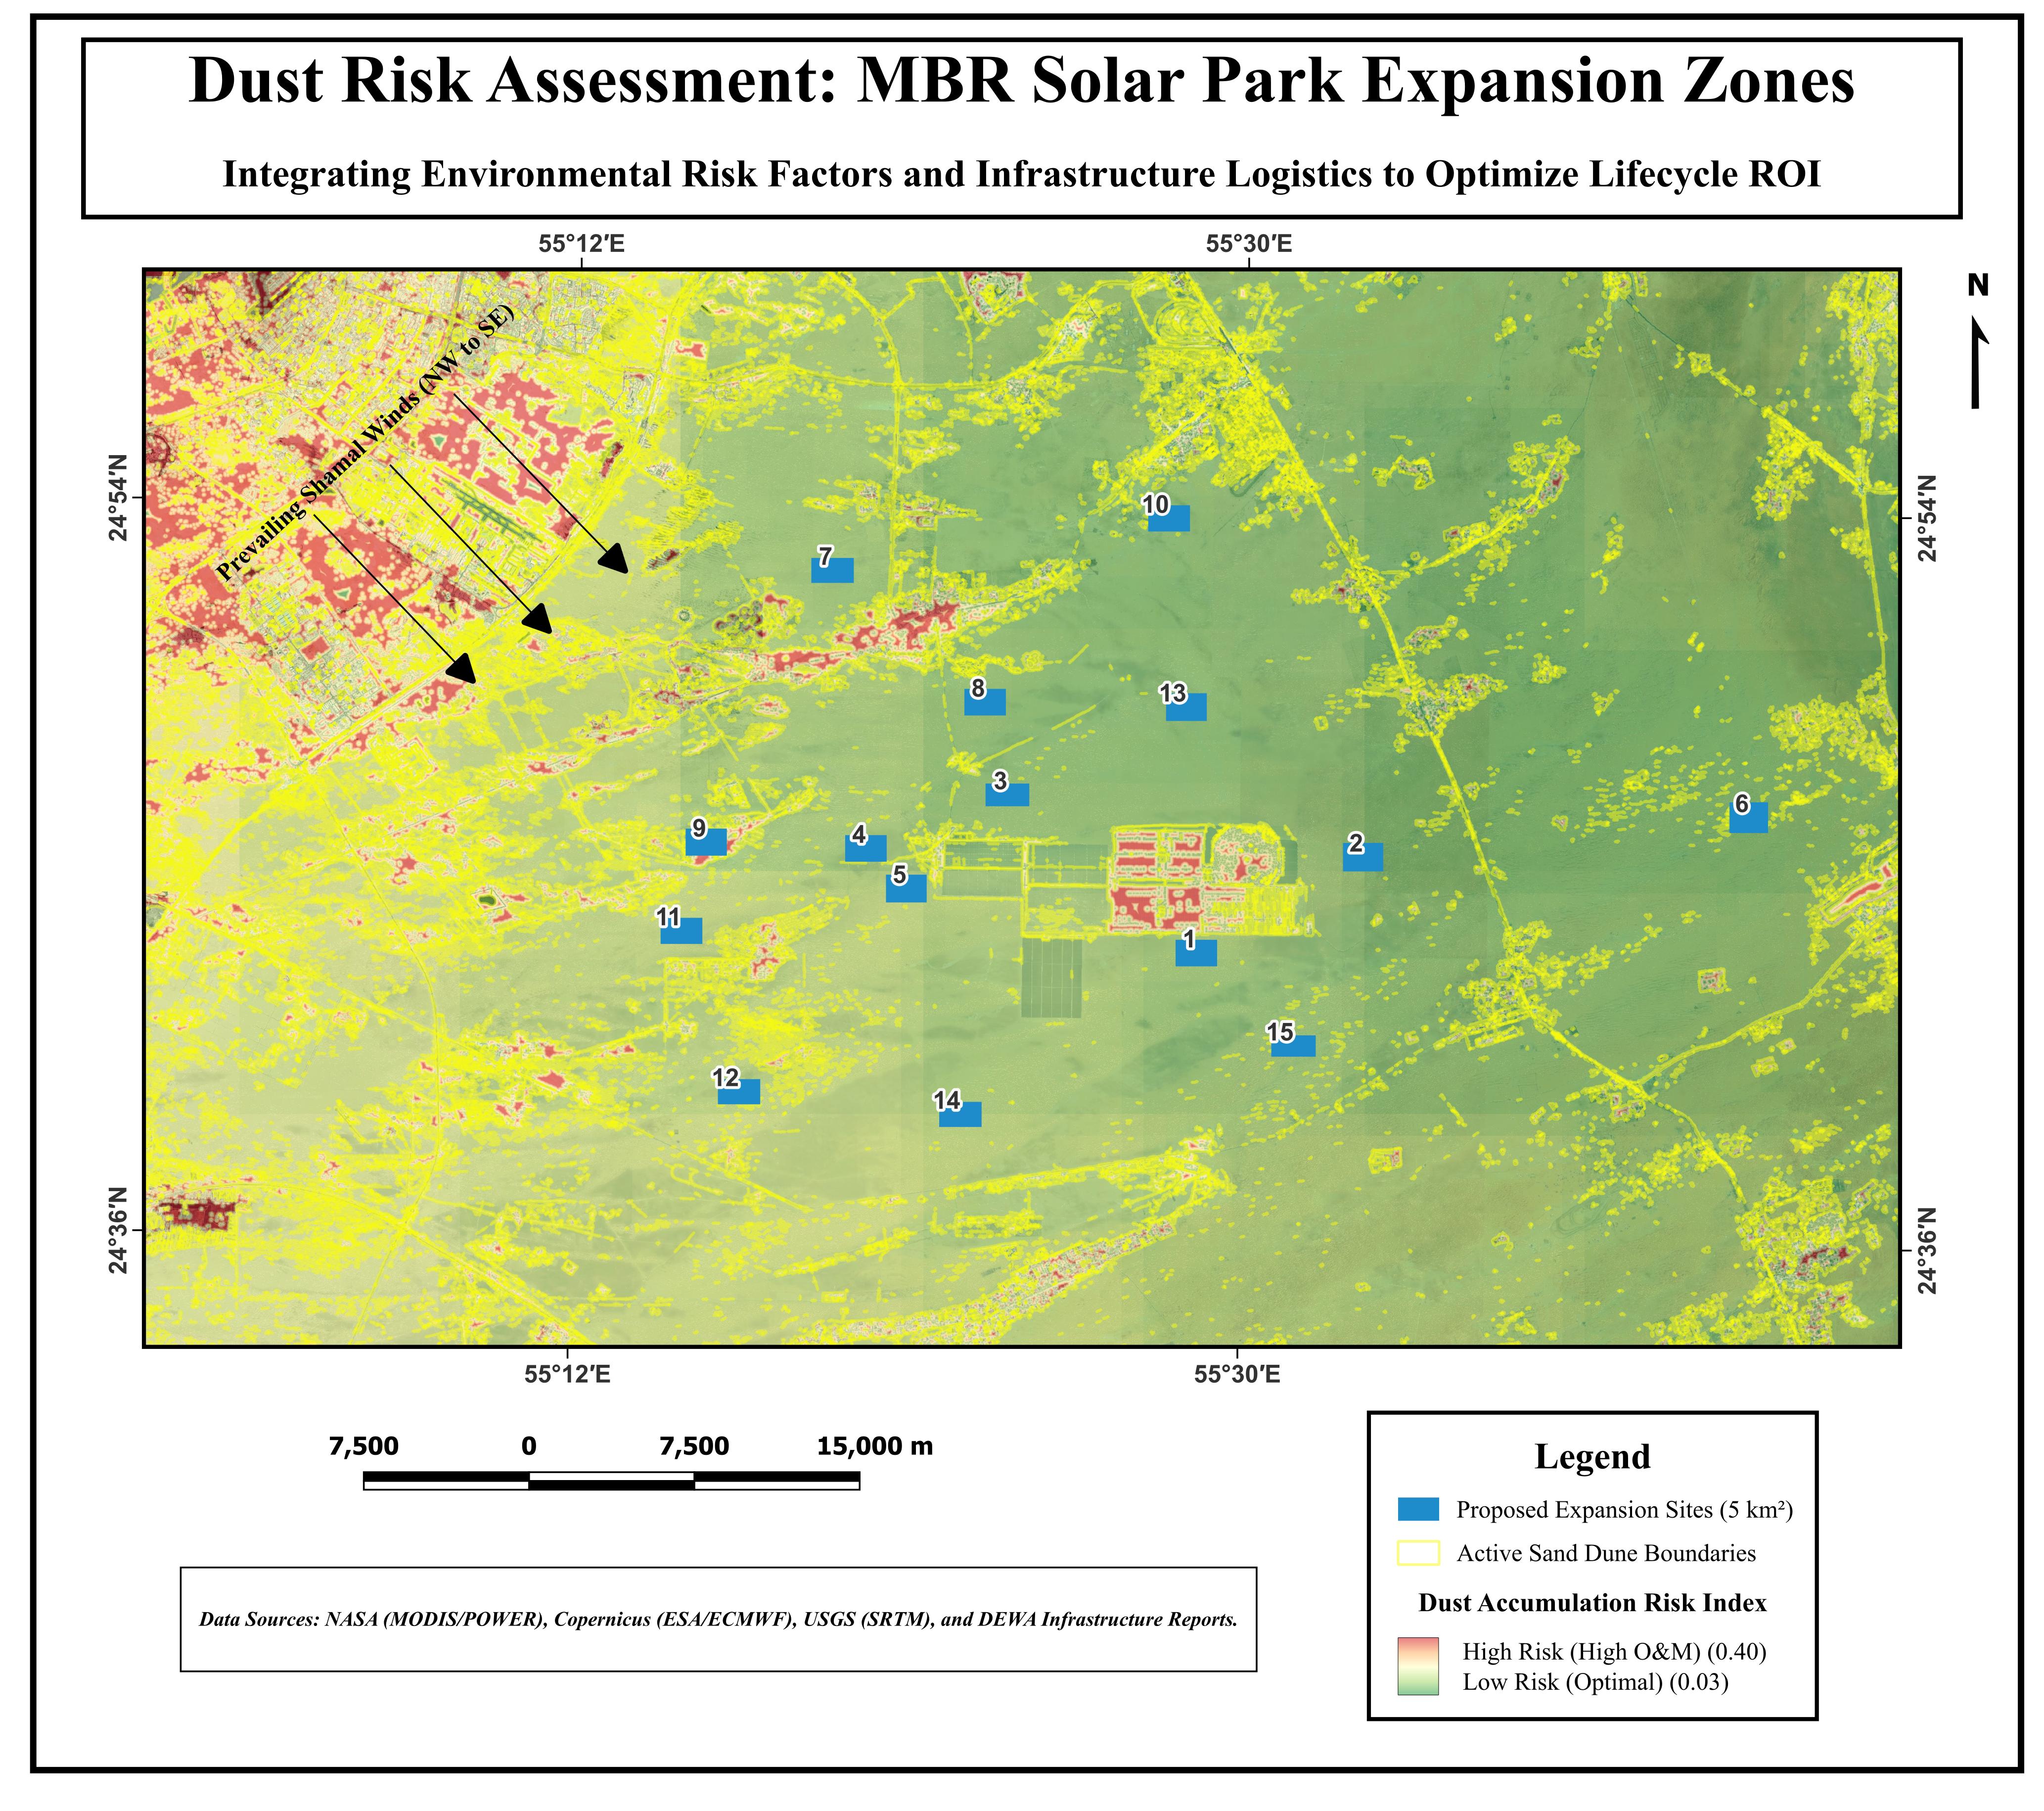
The Shamal Vector
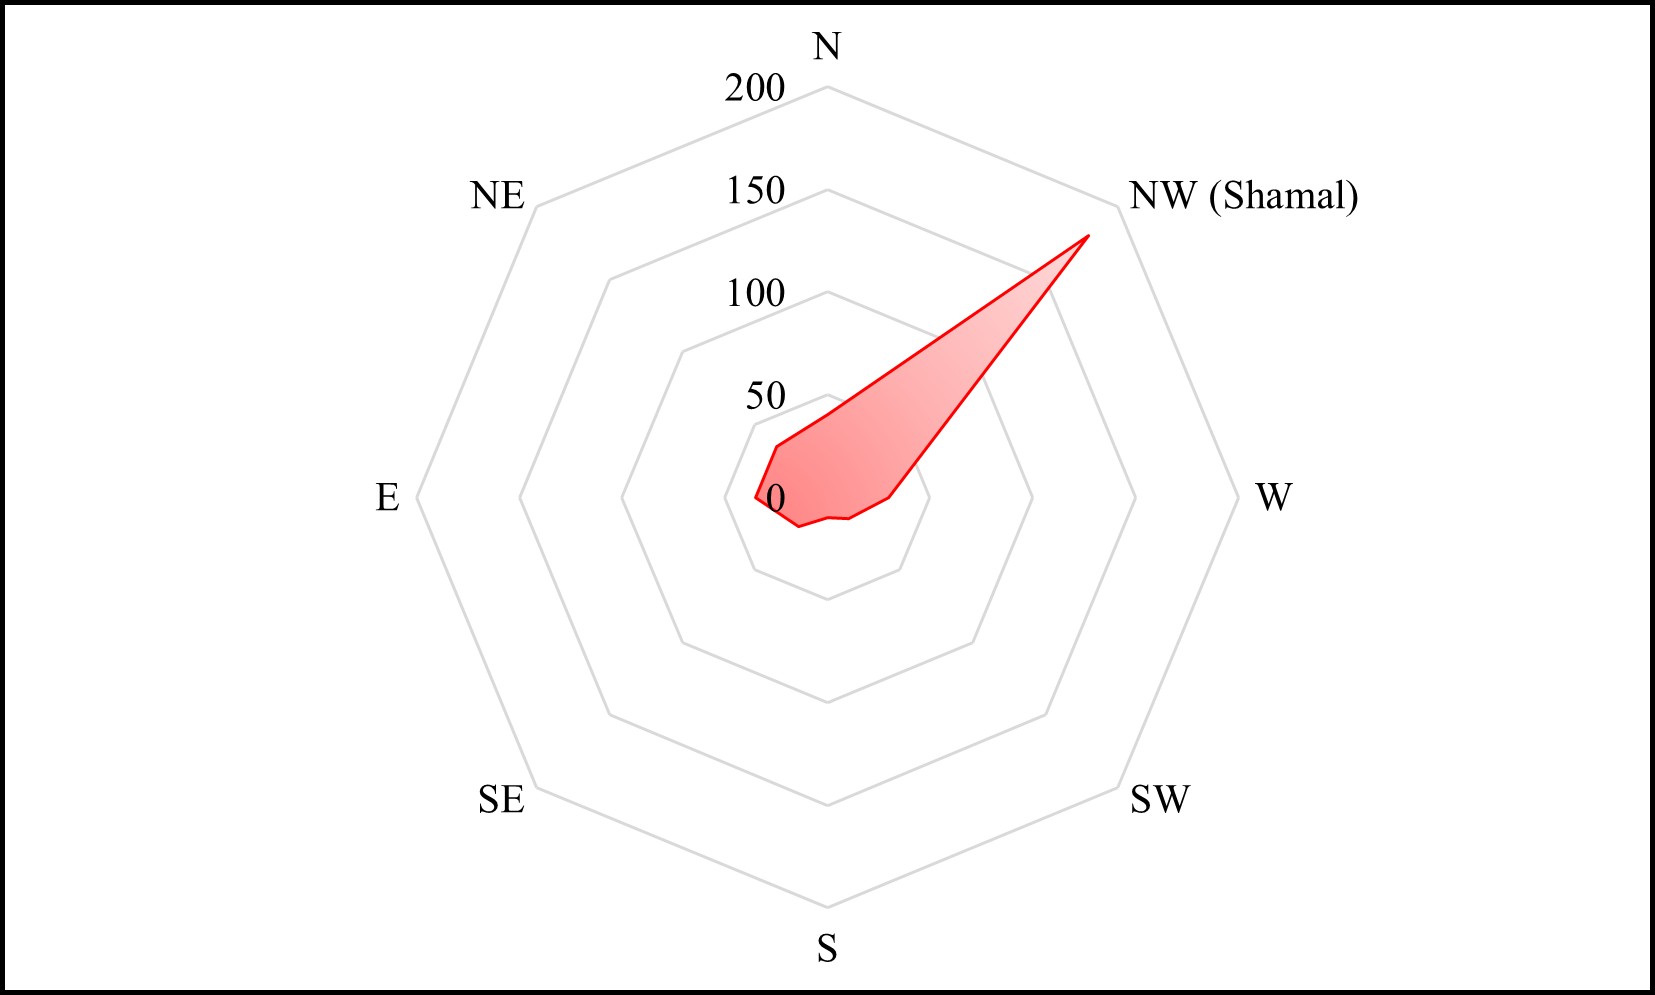
NW winds drive primary sand saltation risk. Sites in the SE corridor leverage orientation logic to achieve 0% upwind dune exposure.
3. Operations & Financial Performance
Seasonal AOD Trends (2020-2024)
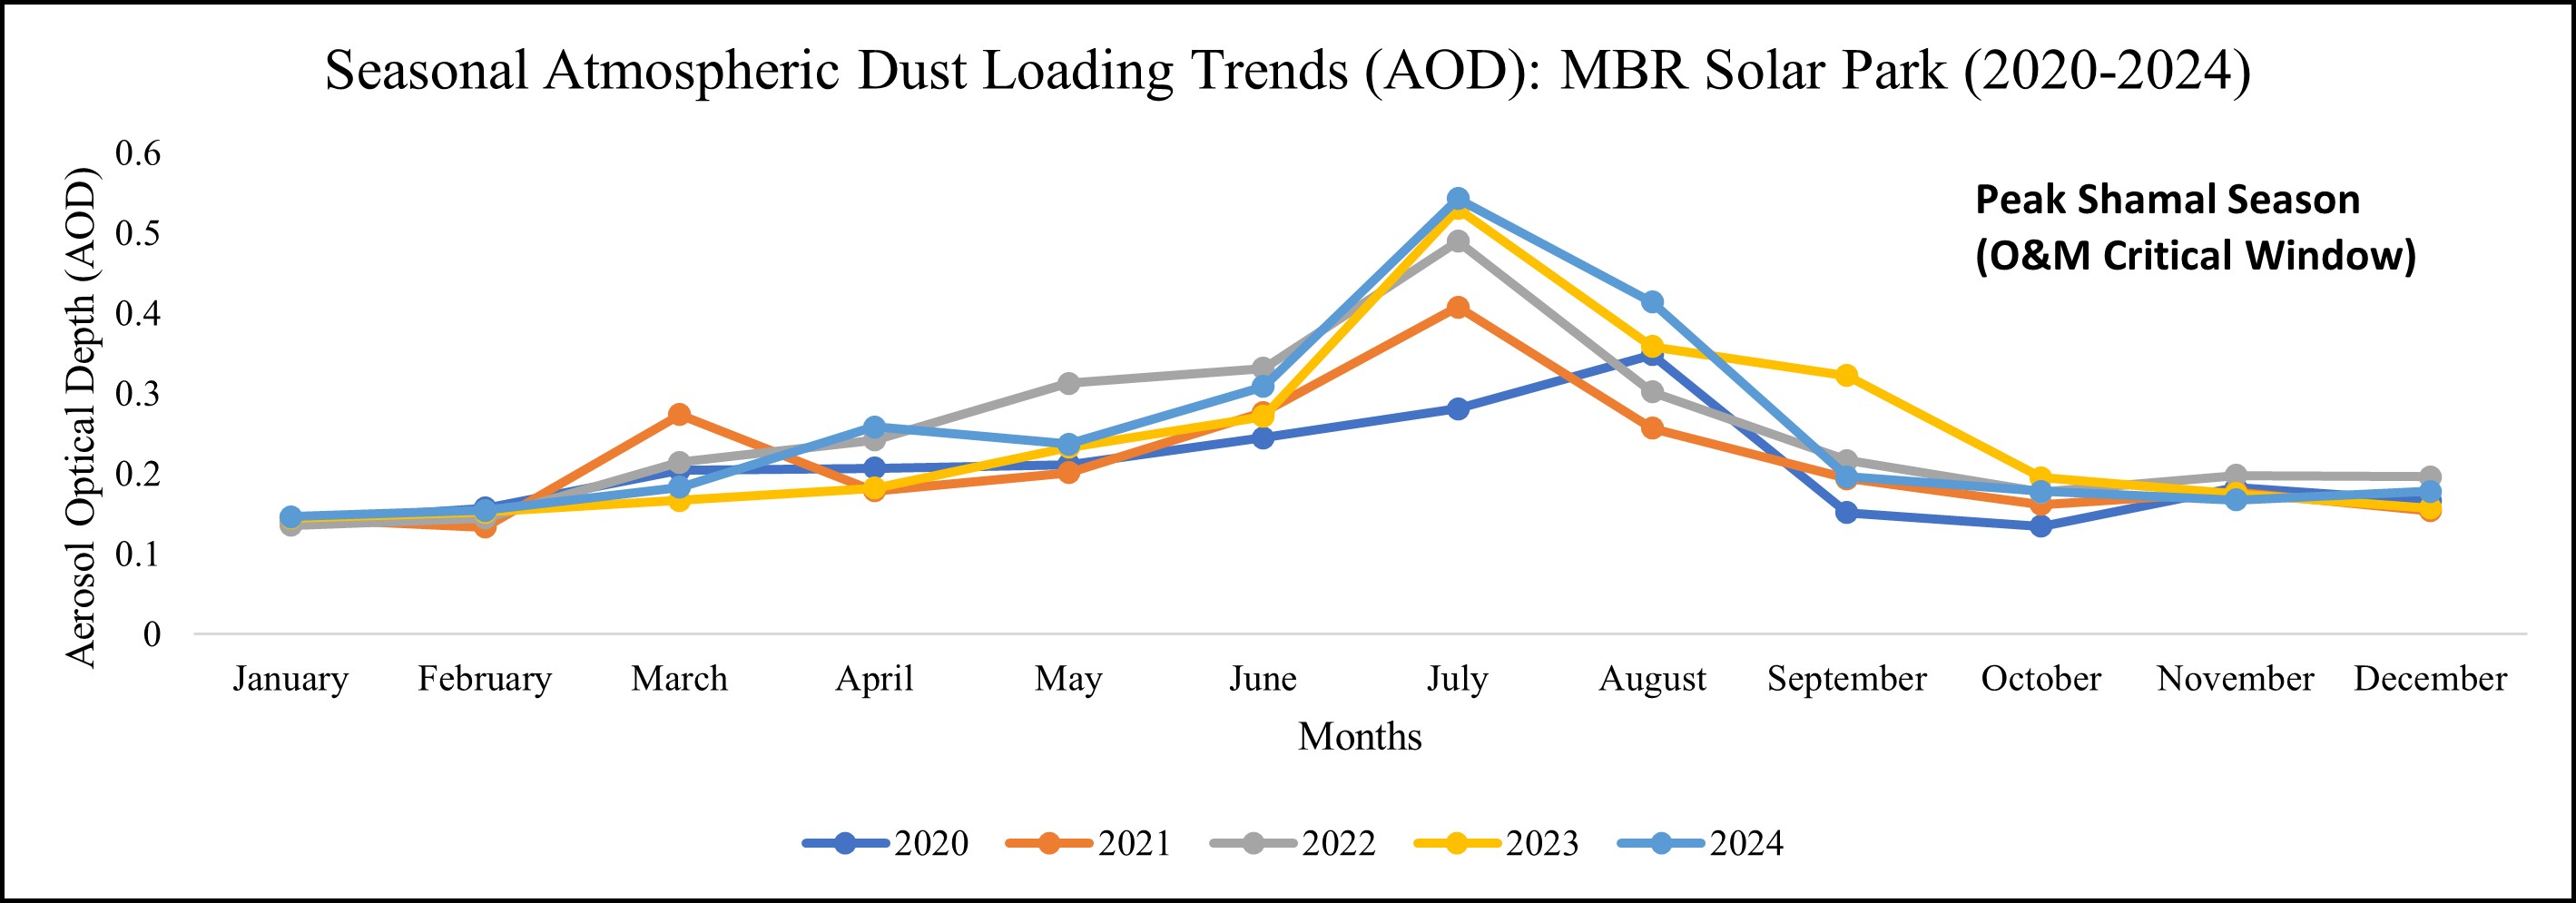
NASA MODIS monitoring identifies a peak "Dust Season" (June-August), driving the requirement for dynamic O&M resource allocation.
Model Validation (R² = 0.998)
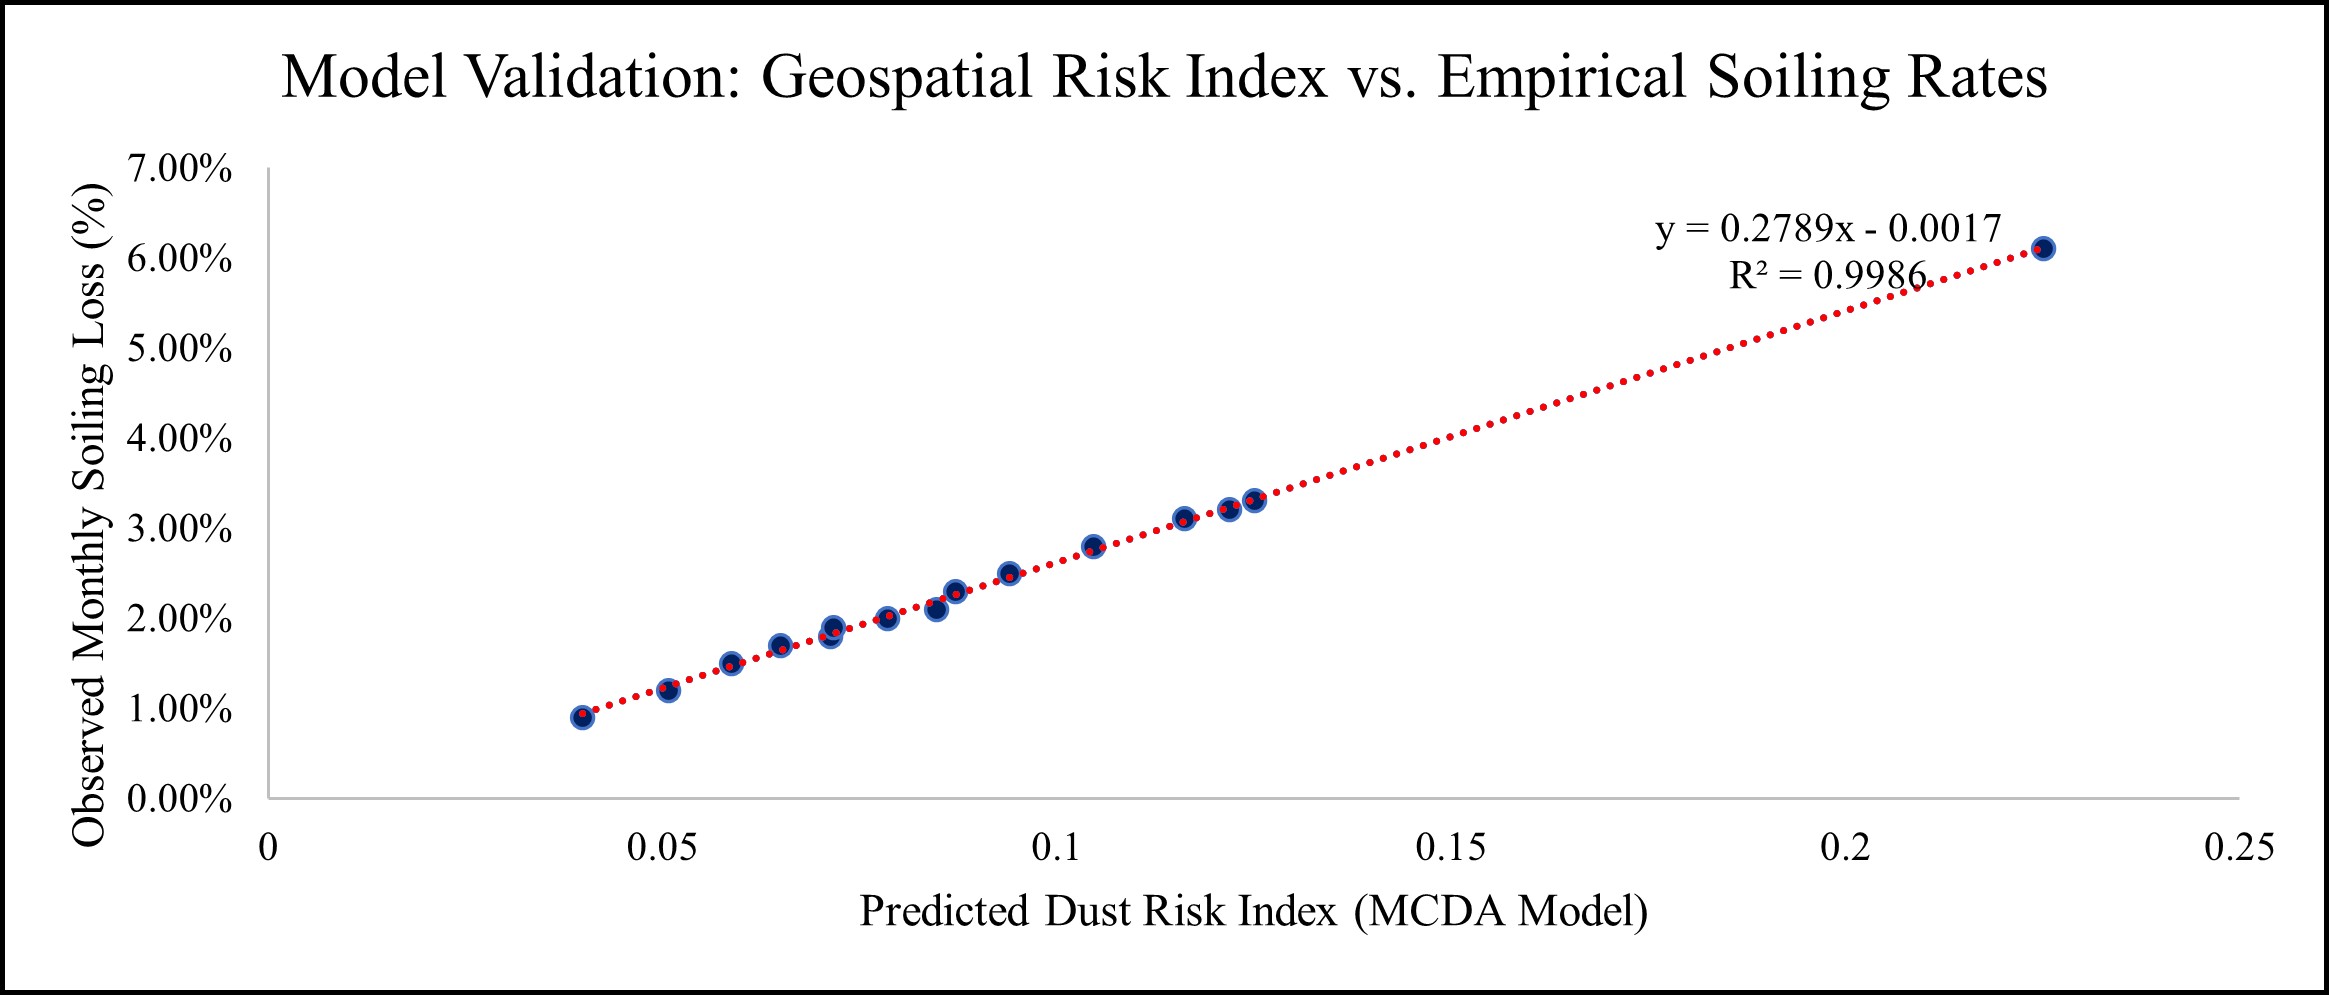
Regression analysis confirms the geospatial model as a statistically significant predictor of energy degradation and maintenance overheads.
Projected 25-Year Net Value (AED)
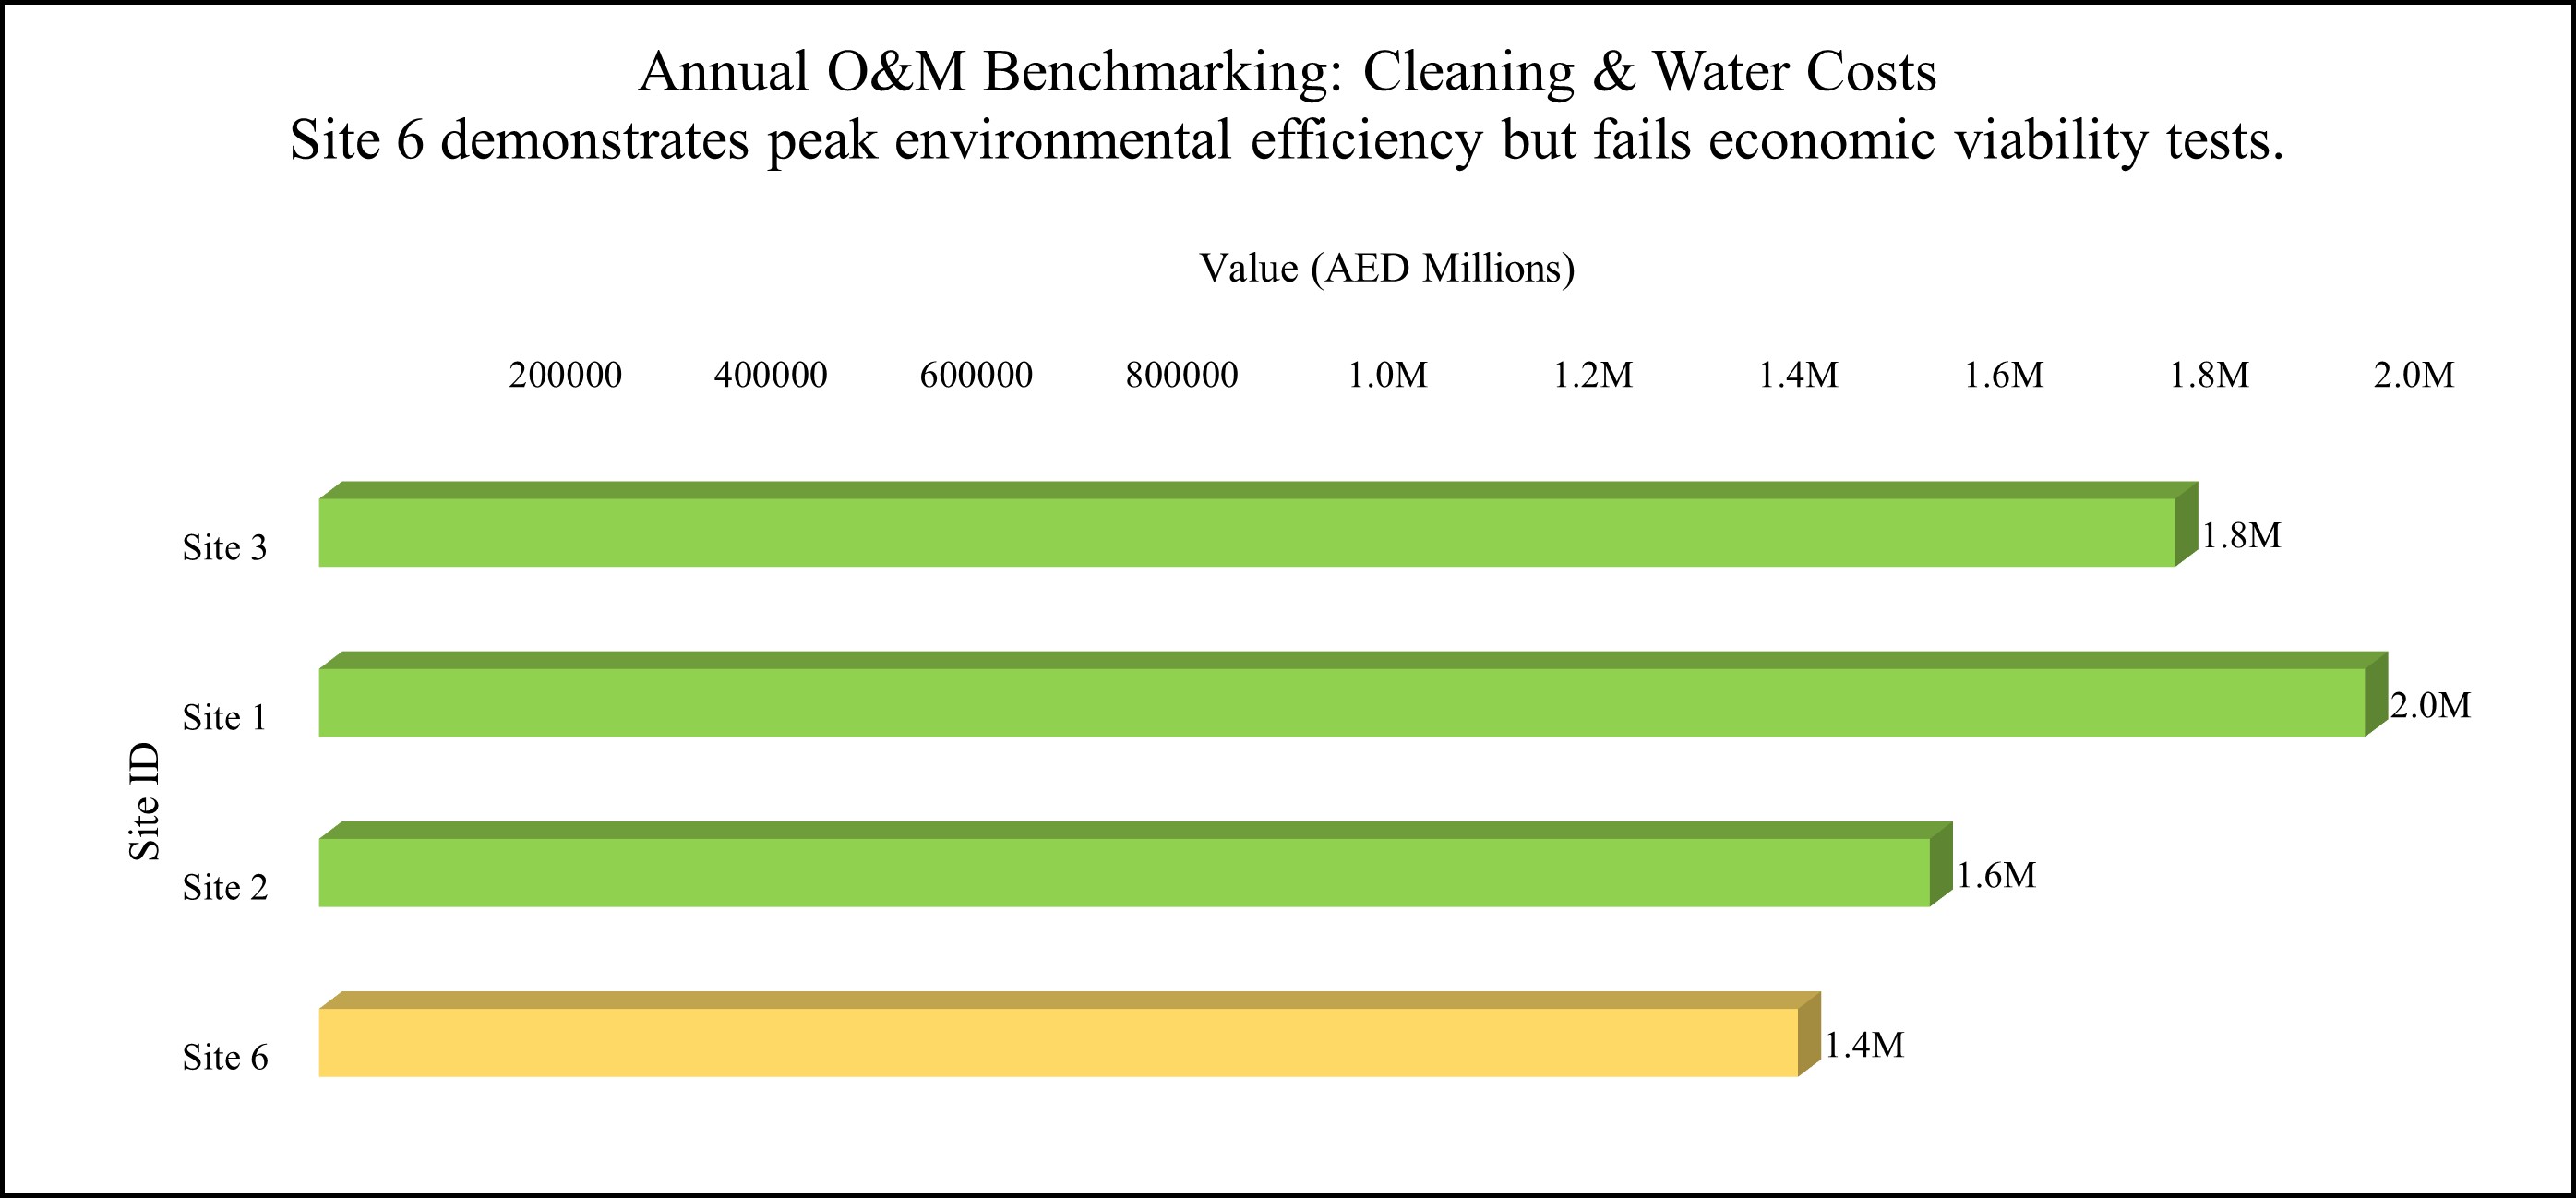
Annual O&M Benchmarking
4. Geospatial Decision Matrix